
When purchasing an animal, DHIA records (certified individual cow milk records) can be a very helpful tool in determining what kind of potential your milk cow or heifer has.
When you go to look at an animal for sale and the buyer says, “She is a very high producer!” what comes to your mind? Your idea of a “good milker” could be very different from their idea. Do you want a cow that gives less volume, but lots of components (butterfat, protein, etc.) or do you just want the type of cow that milks 10 gallons a day?

If you are buying a heifer, DHIA records might be available for her mother (dam), or grand-dam, great-grand-dam and so on. Also, if you can find out the sire of your animal, you can look up his maternal line. Between these two maternal lines, you should have a pretty good idea of what your heifer/cow will produce, although you must take into consideration that feed types and quality can sometimes change the numbers quite dramatically.
For those who own AJCA registered Jerseys: If you have a owner number, you can sign up for the free InfoJERSEY program, and look up all posted records on your cow’s lineage at: www.infojersey.usjersey.com
For those who own Canadian registered Jerseys: Public access is available to view pedigrees at: http://www.jerseycanada.com/ – then click on “Pedigree Database”
Even if you can’t afford DHIA for one or a few animals, you can keep your own similar milk records (which may actually be more accurate if done daily!):
- Before milking, you can use a scale with a hook to weigh your bucket of milk and zero it out.
- After milking, weight the bucket with milk and record the pounds of milk.
- Write the numbers on a calendar and note any changes that might occur: For example, if she is in heat and did not have a good let-down or if she has a little bit of Ketosis and what you treated her with.
- Once a month (more often = more accurate) you can send in a milk sample to a dairy lab:
- Pick up sterile tubes from the lab or from a vet – either milk or blood tubes are sufficient, but you can call your lab to verify.
- Collect a small test tube of milk from the milk bucket before pouring off into jars.
- Mail the sample to the lab and they can analyze for somatic cell & components (fat and protein).
- Components can increase in winter and late in lactation, so testing a few times would give a better idea of what your cow gives.
- California Mastitis Test (CMT) can check for mastitis, but is simply an indicator and does not tell you if it’s just really high somatic cell count from late lactation or actual mastitis or… it’s just a warning flag that something is wrong.
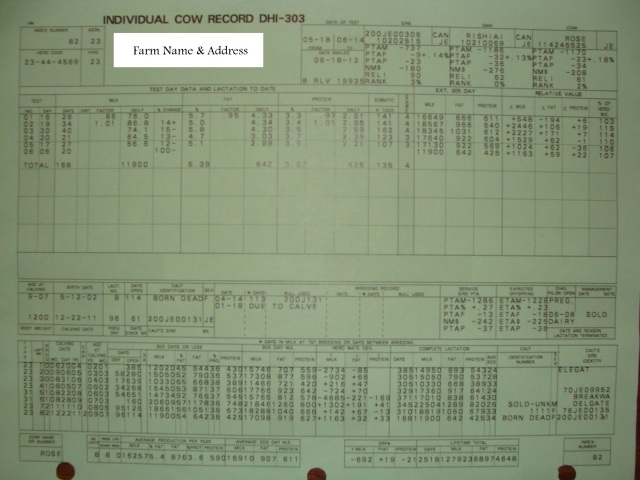
INTERPRETING OFFICIAL DHIA RECORDS:
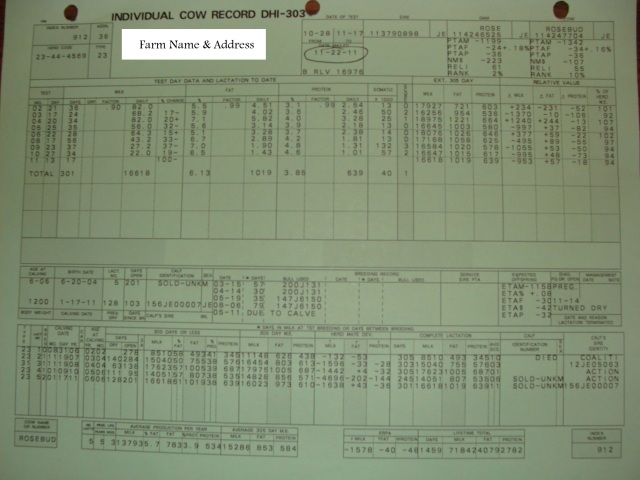
There are different DHIA companies, so your records may not look like the ones in these pictures. Using the data information, you should be able to compare most of your information with the information here.
 At the top of the sheet on the right is a section that has the sire, dam, & name or number of the cow tested. The boxes include projected information (similar to what the bull proofs have). Make sure you’re looking at the right animal’s information!
 Under Test Period – First, you will see one or more monthly records. To the left will be the month and day tested (ie. 9-15, 10-21, 11-20, 12-24). Next to the number will be an A or P for AM testing or PM testing or both. Days is for the number of days between tests.
“Daily” shows how many pounds she gave that day.
3x – if marked down each line, indicates if the herd is milked 3 times per day.
“PM%” adjusts for time, so say you milk at 11 and 13 hour intervals, it adjusts what she gave at the one milking to equalize 12 and 12 hours apart.
Go back to the left column under “Test Period” and look down it at the word “TOTAL” –
- Looking across the row, you will see a number under “Days” which is how many days the cow is into her lactation (ie. 364).
- Under “Daily” is the total pounds of milk (ie. 22,380).
- Under “Fat” and “Protein” shows the average percentage and total pounds as of the last test. This cow has been milking longer than the normal 305 days.
 Under Fat – “%” accounts for what percent of the milk is butterfat. Jerseys are usually 3.5% and higher (I’ve personally seen as high as 7%, but 5% is more likely.) “Daily” is how many pounds make up the daily percent.
Under Protein or SNF (SNF = Solids Non-Fat) – Same explanation as fat %.
Cheese yield – A calculation based on protein and fat, higher numbers are more ideal (more cheese per gallon of milk!)
 Under SCC (Somatic Cell Count) – Somatic Cells are white blood cells, mostly leukocytes, that are an indicator of infection. Multiply the number you see by 1,000 to get the true number. So, if you see “45″ it really means 45,000 somatic cells per count. SCS (Somatic Cell Score) is a number from zero or higher and just takes the SCC and puts them into ranges. SCC below 200 (200,000) is considered healthy. Notice this cow was healthy on her first test (45/2) and then jumped (966/6). She showed no outward signs of mastitis, but obviously had some sort of health issue flare up that should be addressed.
Ext. 305 Days – These columns represent “actual” projections for how much the cow will give in a 305 day lactation.
 Relative Value – Compares your cow to others in the herd based on milk, fat, and protein pounds. This cow averages 111% of herd average, so she is above the production of many of the cows in the herd.
FCM (Fat Corrected Milk) – What percentage of herd average the cow is, so a 95% FCM would be below herd average. 122% FCM would be a very good producer within her herd. This is a good comparison within a herd as to how individual cows are performing and competing.
BOTTOM HALF:
- This cow calved at (7-01) seven years and one month old.
- She herself was born 3-12-2001 and her last calf was born on 4-26-2008.
- This is her 6th lactation;
- She has been open 245 days;
- She was dry for 56 days before her last calving;
- 119 days have elapsed since her last breeding date.
- She had a (F) Female (J) Jersey calf that was an Embryo (V) out of another cow named Circus.
- She has been bred on 9-18, 11-11, 12-27 to three different bulls.
- “Days” are the days between breedings.
- Her last breeding on 12-27 confirmed her pregnant and her due date is 10-03 of the next year, due to “Action”.


The lowest large section shows “Previous Lactations” and is a fun section.
It shows:
- each lactation,
- when she calved,
- how old she was at calving time,
- how many days dry, open, and in milk.
- Then it shows 305 day numbers for milk/fat/protein/SCS (score, not count).
- Mature equivalent numbers (what a similar aged cow “should” milk).
- To the far right is a section that some people complete, which shows if she had male or female calves and who she was bred to.


The bottom section has:
- the cow’s ID number,
- total lactations,
- days of productive life,
- how much milk/fat/protein she gave on average for each day of productive life (since 2 years old).
- “Lifetime Total” is very fun and shows total days of actual days “in milk” and actual pounds of milk, and fat and protein.

For more information: http://www.mndhia.org/newhs/newhs-owner.html
On a pedigree, the numbers will show up like this:
-
1-11 is age at first calving, 3-01 is age at second calving, etc.
-
305 is the number of days in the record and is a standard number. 290 indicates she was dried off early for some reason.
-
2 = twice a day milking
-
16940 = pounds of milk produced in this lactation in 305 days
-
4.4 = percent of butterfat x total pounds of milk (.044 x 16940) = 745.36
-
3.3 = percent of protein x total pounds of milk (.033 x 16940) = 559.02
-
DCR = Data Collection Rating, how accurate is the data. 75 or higher number is better
-
cheese yield?
WHAT SHOULD I LOOK FOR IN A GOOD FAMILY COW?
- Under “Age at Calving” my best cow’s record shows 2-01, 3-03, 4-03, 5-02, 6-03, etc.. This means, she had her fifth calf at just over 6 years old. Must be the kind of cow that breeds back right away, so no reproductive issues. That’s good!
- Under “Milk” we like to see a Jersey start out around 10-14,000 pounds and as she has more lactations, you’d like to see a cow that increases slowly to 15-16,000 and higher. (Different breeds = different numbers, this is referring to “easy keeper” “long-lived” Jerseys.)
- More importantly, I want to see under “fat” that she is always around or above 5% butterfat and “protein” the higher the better (3.6 is good, 4.0 is great!).
- Under “AVG SCS” the lower the number, the healthier the udder, as long as it’s not too low (it’s important to show some activity to indicate the udder has some somatic cells and the ability to fight off infection.)
- Over at the top right of the overall page, it’s good to have a cow near 100% or above on FCM. This means she is competitive and hearty and can “pay her way” as I like to say!
DHIA records may come in various formats. Below are some examples of monthly records (that also include information on completed prior lactations):
FUN NOTE:
Back in the good ole days, dairy producers gave awards to cows for production.
Any cow that reached 2,000 lb. of butterfat (within three lactations…)
would win a “Ton of Gold” award,
and if she was a really good fat producer and got older,
she could win a “Double Ton of Gold” award!
Has your cow won Gold for you? Better thank her! 🙂


Thank you for such a simple description.
But I am sorry that I could not understand the line –
4.4= percent of butterfat 740 = pounds of butterfat (16940 x .044), and
3.3 = percent of butterfat 563 = pounds of butterfat (16940 x .033)
LikeLike
To calculate the total pounds of butterfat given in one lactation, you can take the total pounds of milk produced (which in this example is 16940) and multiply it by .044 (which is the same as 4.4%) and the answer you get is 745.36 pounds of butterfat produced in that lactation. or 559.02 for protein.
Thank you for finding my error. I did not write out the explanation very well, combined with the fact that the DHIA record is calculated with slightly different numbers, so the number does not come out exactly as they have it. They might round up a little bit for calculations which could answer why their total pounds are off by a few.
I hope this fixes your confusion, and again, thanks for catching the mistake!! 😉
LikeLike